




Most Instagram reports are a wall of numbers with a screenshot on top. Reach went up. Followers went up. Engagement went down. Cool. Now what?
A report that lists what happened is a scoreboard. A report that explains why it happened, and what you’ll do about it, is a strategy document. The gap between those two things is where most social media managers lose eight hours a week.
Here’s what we’ll cover:
- The 5 metrics worth tracking weekly (and the ones that waste your time)
- A three-part report structure that forces an action item
- Automation tools that pull data while you sleep
- Reporting mistakes that make good work look bad
- A free Google Sheets template you can copy today
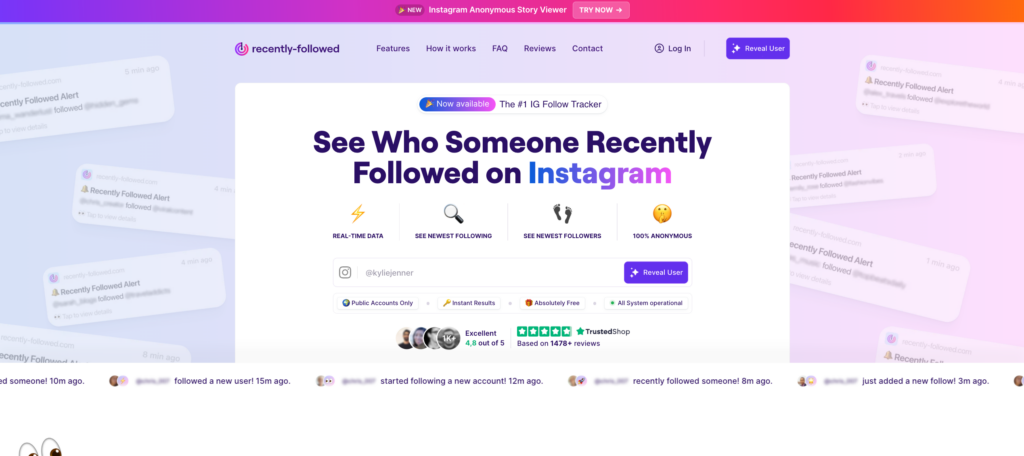
Recently-Followed fills the biggest blind spot in every Instagram report: follow activity you can’t see natively. Check who any public account recently followed, no login required.
The 5 Metrics That Actually Matter
Instagram gives you dozens of numbers. Track all of them and you get noise, not clarity.
One thing to know before you start: Meta deprecated impressions and plays in favor of a unified “views” metric across Reels, videos, Stories, carousels, photos, and lives, on both Facebook and Instagram, as of April 2025. If your old report template still has an impressions column, it’s been broken for over a year.
The April 2026 redesign added a tabbed dashboard (Overview, Engagement, Audience), share rate and skip rate metrics, Views Over Time data, and post-watch behavior data for Reels. Worth rebuilding your template around.
1. Follower Growth Rate (not follower count)
Raw follower count is the vanity metric to end all vanity metrics. Growth rate is the real number.
Formula: (New followers this week ÷ Total followers at week start) × 100
Track the percentage. A jump from 10,000 to 10,100 is 1%. A jump from 500 to 600 is 20%. Same 100 followers, completely different story.
Benchmarks worth knowing:
| Account size | Healthy weekly growth |
|---|---|
| Under 1K | 3-5% |
| 1K-10K | 1.5-2.5% |
| 10K-100K | 0.5-1.5% |
| 100K+ | 0.2-0.8% |
Anything above 10% weekly usually means bots, a giveaway, or a viral moment that won’t repeat.
2. Unfollow Spikes
The metric nobody reports on, and the one that tells you the most.
Instagram Insights shows net follower change. Net hides everything. Gain 200 and lose 180, and the dashboard shows +20, which looks like a slow week rather than the churn disaster it actually is.
Track gross, not net. Followers gained and followers lost, as separate columns. When a loss column spikes, go find the post that caused it. Our guide on why people unfollow on Instagram covers the usual triggers, and most of them are fixable.
Pro tip: unfollow spikes almost always trail a specific post by 24-48 hours. Line up your loss data against your posting calendar and the culprit surfaces fast.
3. Engagement Ratio
Follower growth rate and engagement rate should be read together. If growth is strong but engagement is dropping, you may be attracting followers who aren’t actually interested in your content, which is often a side effect of viral moments or giveaway campaigns pulling in the wrong audience.
Formula: Total interactions ÷ Total reach × 100
Track it weekly. A 2% engagement rate sits below most industry standards, and if you’re watching it slide week over week while followers climb, you have a quality problem dressed up as a growth story.
New in 2026: share rate now appears in the Engagement tab, and Adam Mosseri has publicly called shares the most important engagement signal in 2026 because they represent active recommendation rather than passive consumption. Add it to your template.
4. Story Completion Rate
Stories are where audience attention gets tested honestly.
Formula: Viewers on last frame ÷ Viewers on first frame × 100
A 70%+ completion rate means your story sequence holds. Below 50% and people are tapping away, which tells you exactly where your hook fails. Skip rate now measures when viewers swipe away from Reels and how quickly, giving you the same diagnostic for short-form video.
5. Recent Follows Activity (yours and theirs)
The metric Instagram Insights will never give you.
Who your audience follows, who your competitors follow, and who your top customers just started following. None of this appears in any native dashboard, on any account type.
It’s public data. It’s just not exposed anywhere useful. Recently-Followed pulls it in seconds, and it’s the only column in your report that tells you about the future rather than the past.
How to Structure Your Weekly Report
Every section answers one of three questions. Skip any of them and you’re back to a scoreboard.
Part 1: What Happened (Observation)
Pure data. No interpretation. Same 7-day window every week, no exceptions, or your comparisons are worthless.
| Metric | This week | Last week | Change |
|---|---|---|---|
| Followers gained | 412 | 380 | ▲ 8.4% |
| Followers lost | 89 | 145 | ▼ 38.6% |
| Growth rate | 1.8% | 1.2% | ▲ 0.6pt |
| Engagement rate | 4.2% | 5.1% | ▼ 0.9pt |
| Story completion | 68% | 71% | ▼ 3pt |
| Share rate | 1.9% | 1.1% | ▲ 0.8pt |
| Top post | Carousel, Tues | Reel, Fri | — |
Part 2: Why It Happened (Evidence)
This is where most reports die. They present a number and let the reader guess.
Bad: “Engagement dropped 0.9 points this week.”
Good: “Engagement dropped 0.9 points. Two of five posts were promotional, versus zero last week. The promo posts pulled 1.8% and 2.1%, while educational content held above 5%. The drop is a content mix issue, not a reach issue, since reach stayed flat.”
Notice the structure: number, hypothesis, supporting evidence, ruled-out alternative.
Rules for this section:
- One paragraph per anomaly, not per metric
- Only explain the things that moved
- Say “probably” when you mean probably
- If you can’t explain a change, write “unexplained, investigating” instead of inventing a reason
Part 3: What To Do Next Week (Action)
Three items maximum. Each one owned, each one dated, each one testable.
- Cut promo posts to one per week. Test against the 5%+ educational baseline. Owner: content. By: Friday.
- Re-hook Tuesday’s Reel format. Skip rate hit 45% in the first 3 seconds. Owner: video. By: Wednesday.
- Audit the 89 unfollows against Thursday’s carousel. Owner: analytics. By: Monday.
If your report has no action items, it isn’t a report. It’s a receipt.
Tools to Automate Data Collection

Manual reporting is a tax you pay every Monday morning. Automated reporting saves an average of eight hours per week, and it kills the transcription errors that quietly poison your historical data.
Native Instagram Insights
Free, and the baseline for everything.
What it gives you: reach, views, engagement, audience demographics, content performance, profile visits, website clicks.
The catches:
- Requires a Creator or Business account
- Follower trend insights need at least 100 followers, and demographic breakdowns need 100+ reached or engaged accounts
- Full Insights lives in the mobile app, with only partial data in Meta Business Suite on desktop
- Data refreshes with a lag, so real-time it is not
Verdict: essential, incomplete. Start here, don’t stop here.
Google Sheets + Manual Entry
Free, flexible, and slow. Fine for one account. Miserable for multiple clients.
Use it as your destination, not your collection method.
Third-Party Dashboards
Sprout Social, Metricool, Socialinsider, Looker Studio. They connect straight to Instagram’s API and refresh on a schedule.
| Tool | Best for | Watch out for |
|---|---|---|
| Looker Studio | Free custom dashboards, multiple clients | Setup is fiddly, needs a connector |
| Metricool | Small teams, cheap tier | Data limited without a Facebook connection |
| Sprout Social | Agencies, professional reports | Expensive |
| Socialinsider | Competitive benchmarking | Overkill for a single account |
Recently-Followed (for the data none of them have)
Every tool above reports on your account. None of them tells you what your audience is doing elsewhere.
That gap matters. When your engagement rate slides for three straight weeks and reach holds steady, the answer usually isn’t in your dashboard. It’s in your audience’s attention, moving somewhere else.
Recently-Followed shows you where. Enter any public username, see who they recently followed, and read the drift. When ten of your most engaged followers all start following the same competitor in the same week, that’s not a coincidence. That’s a report line item.
It runs without your Instagram login, which matters more than it sounds. Any reporting tool asking for your password rather than an official API connection is a liability sitting inside your workflow. For a fuller breakdown, see our comparison of anonymous Instagram follower tracking tools.
Common Mistakes in Instagram Reporting
Some of the most common mistakes in Instagram reporting are below:
Mistake 1: Reporting vanity metrics
Follower count, total likes, and total views feel good and mean little in isolation. If a metric can go up while the business goes nowhere, it belongs in an appendix, not a headline.
The test: if this number doubled, would you change anything? No? Cut it.
Mistake 2: No context, no baseline
“4.2% engagement rate” is meaningless. Against last week? Against your six-month average? Against your industry? Every number needs a comparison, or it’s decoration.
Mistake 3: Shifting the reporting window
Reporting Monday-to-Sunday one week and Wednesday-to-Tuesday the next makes every comparison garbage. Pick a seven-day window. Never move it.
Mistake 4: Explaining noise
Not every fluctuation has a cause. A 0.1% engagement wobble is noise. Building a narrative around it teaches your team to trust patterns that don’t exist.
Rule of thumb: ignore anything under a 10% relative change unless it’s part of a multi-week trend.
Mistake 5: No action items
The most common failure, and the most expensive. A report without a decision attached is a document nobody reads twice.
Mistake 6: Ignoring gross churn
Net follower change is a comfortable lie. Track gained and lost separately or you’ll never see the leak. Our breakdown of who unfollowed me on Instagram walks through how to surface the losses natively.
Mistake 7: Reporting only on yourself
Your account doesn’t exist in a vacuum. A flat week for you might be a flat week for your entire category, in which case you’re fine. Or your competitors might be up 30%, in which case you have a problem. Same numbers. Opposite conclusions.
Free Weekly Report Template
Copy this structure into Google Sheets, and you’re running in ten minutes.
Tab 1: Raw Data
Columns: Date, Followers gained, Followers lost, Net change, Growth rate %, Reach, Views, Interactions, Engagement rate %, Share rate %, Story completion %, Profile visits, Website clicks.
One row per week. Never delete rows. Your historical baseline is the whole point.
Tab 2: Content Log
Columns: Post date, Format (Reel/carousel/static/Story), Content pillar, Reach, Interactions, Engagement rate, Shares, Saves, Skip rate.
This is what lets you say “carousels outperform Reels for us by 40%” instead of “I think carousels do well.”
Tab 3: Competitive Watch
Columns: Competitor handle, Follower count, Weekly change, Recent follows spotted, Notes.
Populate the “recent follows” column with Recently-Followed. It takes two minutes a week and it’s the only forward-looking data in the entire sheet.
Tab 4: The Report
Your three-part structure. What happened, why, what next. Pull the numbers from Tab 1 with cell references so it updates itself.
Formula worth stealing:
=IF(B2=0, “N/A”, (B2-B1)/B1) for week-over-week change on any metric.
Scaling Your Instagram Analytics Report
A single weekly report is a habit. A reporting system is leverage. The difference shows up the moment you manage multiple accounts, or the moment your marketing team asks how Instagram contributes to actual revenue.
Connect Instagram data to a second data source
Instagram Insights data stops at the edge of the app. It tells you someone tapped your bio link. It goes quiet after that.
Google Analytics picks up the thread. Tag every bio link and story link with UTM parameters, and suddenly your Instagram performance report can follow a person from a Reel to a website visit to a purchase.
The UTM structure to use:
?utm_source=instagram&utm_medium=bio&utm_campaign=march_launch
Now you can measure performance across the whole funnel:
| Stage | Data source | Metric |
|---|---|---|
| Exposure | Instagram Insights | Views, reach |
| Interest | Instagram Insights | Engagement metrics, saves, shares |
| Intent | Instagram Insights | Profile visits, link taps |
| Action | Google Analytics | Click-through rate, sessions, bounce |
| Outcome | Google Analytics | Conversion rate, revenue |
Two data sources. One complete picture. Without this bridge, you’re reporting on attention and calling it business impact.
If you’re running Instagram ads alongside organic, pull ad spend into the same sheet. Cost per result next to organic engagement rate is one of the most honest comparisons you can put in front of a marketing team. Same for Google Ads, if the same campaigns perform across both channels.
Segment data, or drown in averages
An average engagement rate across an entire account hides more than it reveals.
Segment by:
- Format: Reels vs. carousels vs. static vs. Instagram stories. One of them is carrying you.
- Content pillar: educational, promotional, behind-the-scenes, user-generated.
- Audience segment: followers vs. non-followers reached.
- Follower demographics: age bands, cities, and language, straight from the Audience tab.
- Time posted: the hour-by-hour activity data now sits inside Insights.
Segmented Instagram metrics turn a flat number into a decision. “Our engagement is 4%” is trivia. “Educational carousels pull 6.8% from non-followers while promos pull 1.9% from existing followers” is a content strategy.
Build a professional dashboard once, use it forever
Manual reporting scales terribly. Two accounts is fine. Ten accounts is a full-time job you didn’t ask for.
Google Looker Studio solves this for free. Connect Instagram through a community connector, connect Google Analytics natively, and build custom reports that refresh themselves.
What a good dashboard gives you:
- Multiple accounts side by side on one screen
- Week-over-week and month-over-month comparisons without touching a formula
- Charts that show trend direction at a glance, which no table ever will
- A shareable link, so nobody asks you to email a PDF again
Monthly reports become a filter on the same dashboard rather than a separate build. Quarterly reviews too.
Pro tip: build the dashboard around your business goals, not around the metrics Instagram happens to offer. If the goal is leads, the top row is link clicks and conversion rate. If the goal is awareness, the top row is the reach and share rate. Start from the goal and work backwards, always.
Add competitive analysis to the reporting process
Your own numbers only describe half of what’s happening.
A flat month for your account looks like failure in isolation. If the entire category was flat, it was a market condition. If your three closest competitors grew 20% while you sat still, that’s a different conversation entirely.
What to track weekly on each competitor:
- Follower count and growth rate
- Their top-performing posts, by visible engagement
- Posting cadence and format mix
- Who they recently followed
That last one is the signal nobody else in your industry is watching. Recently-Followed makes it a two-minute job. Enter their handle, read the follows, and you’ll see the influencer partnerships and creator relationships forming weeks before the campaign goes live.
Drop the findings into your competitive tab, and your Instagram analytics report stops being a mirror. It becomes a map.
Report on progress, not just performance
One last discipline that separates a serious analyst from a spreadsheet operator.
Track progress against a target, not just against last week. Set a quarterly goal for growth rate, engagement rate, and conversion rate. Then every weekly report answers one question: are we on pace, or are we not?
Overall performance is a number. Progress is a direction. Only one of them tells you whether to change anything.
Build Reports That Move the Needle with Recently-Followed
A weekly Instagram tracking report is not a data dump. It’s a decision-making instrument. Separate what happened from why it happened, attach an action to every insight, and the same eight hours you used to spend on transcription turn into strategy.
Key takeaways:
- Track growth rate, not follower count, and track gross churn, not net
- Impressions are gone; views replaced them across every format
- Share rate is now the engagement signal Instagram weighs most heavily
- Structure every report as observation → evidence → action
- Automate collection, and never move your seven-day window
- Native Insights only reports on you, which leaves your biggest blind spot wide open
Recently-Followed closes that blind spot. See who any public account recently followed, track competitors and audience movement in real time, and turn a backward-looking report into a forward-looking one. Free, anonymous, no login needed.


.webp)